http://www.businessinsider.com/cryptocurrency-ico-bubble-2017-11
Normally you can’t really tell whether or not something is a bubble until it bursts, but bitcoin at least qualifies in one definition: everyone’s talking about it. That, and its price gains, of course.
These days, if you give a presentation about the markets, the economy, or perhaps future central banking policies, you can almost guarantee that someone will approach you at the end to ask “so what should I think of this bitcoin then?” In fact, as soon as people at a party hear that you work on financial markets, the conversation invariably switches to just one topic: the ins and outs of cryptocurrencies. Although this isn’t the definition of a bubble, at the very least we can say that this bitcoin interest corresponds strongly to the dotcom hype of 1998-2000: then too the topic of conversation at the hairdresser’s suddenly wasn’t about the weather, but focused on internet stocks.
Is there an official definition of a bubble? Not really, although there have been a number of attempts to arrive at a clear description. I once suggested in a column for the Dutch financial newspaper Het Financieele Dagblad that there are four characteristics (duration, indiscriminate buying, bursts within three months, and causes a great deal of economic suffering), but that definition was primarily intended to rein in the somewhat hysterical screams of ‘bubble!’. More serious definitions also factor in liquidity, debt financing (leverage) and claims that we’ve landed in a new world – this time is different – when identifying a bubble, but do not take account of the point at which the burst occurs. The latter of these seems justified in my eyes: that the Nasdaq hadn’t yet begun declining in October 1999 didn’t of course mean that we weren’t talking about a bubble, it’s just that the balloon hadn’t yet been pumped full enough to burst.
The this time is different argument is also the reason why it is so difficult to be certain in advance as to whether or not something is a bubble. The price of bitcoin has definitely risen astronomically, but that’s only logical, right? Just suppose that the blockchain – the technology underlying bitcoin – is indeed the future and that bitcoin is the platform that outlasts all the other hundreds of cryptocurrencies, then why shouldn’t the price continue to race north? After all, bitcoin differs from most investment categories in that it features a fixed maximum supply in the number of bitcoin in circulation, and that was definitely not the case for internet stocks. And if supply is limited, yet demand continues to increase, then it’s not so strange at all that the price is rising, right? As long as you reason in this way, it’s not so odd that there are still so many people who reckon on the price increasing further. Beware, I’m not advising you to buy here: I’m just showing you the reasoning as to why there are still so many people willing to step into bitcoin despite the massive surge in its price.
And now the graph
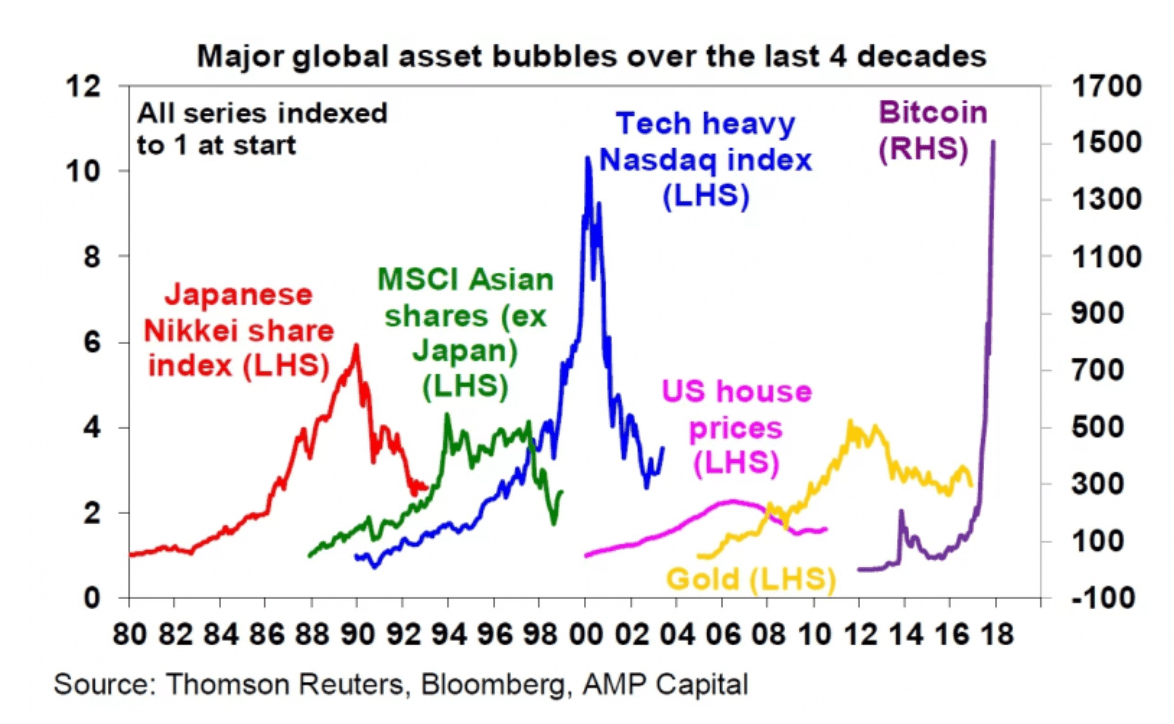
This week’s graph gives us a great overview of the number of bubbles that have burst in the past. The Nikkei, the Nasdaq, gold. It’s not a comprehensive overview, but that doesn’t matter. What I really like about this graph is that it includes the most disastrous bubble of the last 40 years, but that it appears to be nothing more than a minor bump in the road compared to the others – and I’m talking about the US housing market. This graph clearly demonstrates that not all bubbles are equal. It’s not the price rise that determines the degree of pain, but rather just how widespread the contagion is. Whether or not a bursting bitcoin price would at this point in time cause a worldwide recession is a matter of conjecture. Perhaps the only unfortunate thing about this graph is that the price development of bitcoin is placed on the right axis, so it’s difficult to compare its meteoric rise with the trends we’ve seen in the past.
By the way, looking at the graph above I had to think of a chart published by BCA a few years ago showing five major bubbles since the 1960s. The striking thing about this graph is that it seems like there is a bubble precisely every ten years, which then peaks around the start of a new decade. Gold in the 70s, the Nikkei in the 80s, the Nasdaq in the 90s: only Chinese equities in the noughties didn’t stick properly to the timeline. Based on this frequency, the question was of course what the bubble-candidate would be for the twenty-tens. I think it’s fair to say that we’ve found our culprit…
Striking frequency of bubbles (or just coincidence?)

http://www.zerohedge.com/news/2013-05-22/five-decades-asset-bubbles-which-one-next
So how’s bitcoin fairing relative to previous bubbles? First I’ve reproduced the above graph, but without bitcoin and the data series of the nifty 50s (couldn’t find any data for that period):
Spot the difference: without bitcoin…

Source: Robeco, Bloomberg
Take note here: this is a logarithmic axis, making the bubbles visually more mutually comparable. However, this also creates a distortion: in the 70s, gold increased 18 times over, while the Nikkei doubled ‘just’ five times. If I now add bitcoin with an initial value of six cents, which is what it was being sold for over the digital counter in July 2010, the graph is as follows:
…and now with!

Source: Robeco, Bloomberg
If a bubble is defined purely by the degree to which the price has increased, this graph leaves little to the imagination: bitcoin is then by far the largest bubble in recent history. In fact, if you take 2010 as the starting point, this increase is even greater than the 17th century Dutch tulip mania.
To reiterate: the price gain alone is not enough to detect a bubble, as you need at the very least a sustained and major downwards correction for that. But let’s be very clear about this, we’re following developments very closely.
