https://lukasdaalder.com/2016/12/12/best-of-the-web-16-12-12-nr-1576/
Okay, I realize things aren’t that far yet, but I like to be ahead of the herd. After all, one thing is abundantly clear: if the Dow Jones breaks through the historic 20,000 mark, we’ll see plenty of publicity.
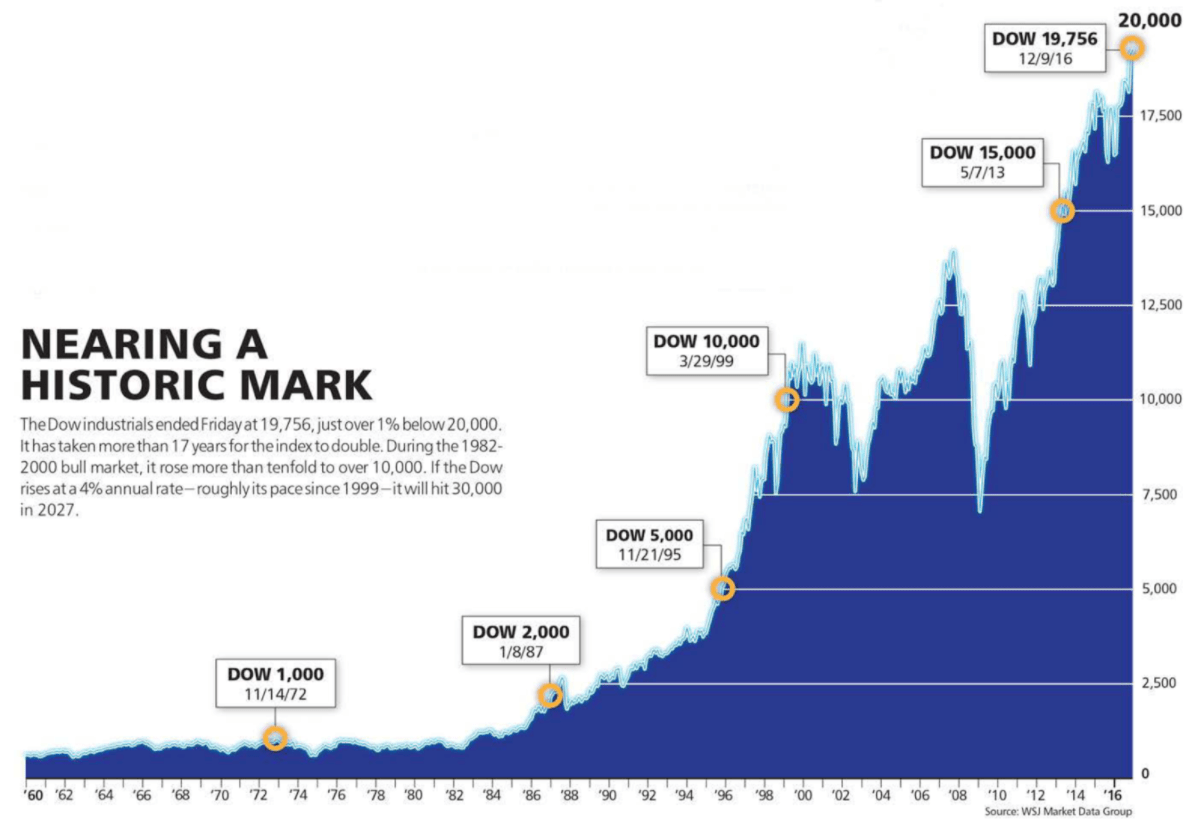
That I’m not the only person who is somewhat ahead of the curve, is demonstrated in the graph, originating from Barron’s. With just slightly less than 1% to go, the US weekly newspaper thought it was high time to already put a spotlight on the Dow. The graph not only shows us the Dow’s historic progress over the last 55 years, but it also gives us a number of earlier historical breakthroughs. The 10,000 mark for instance was smashed in March 1999, the 5000 point barrier was next in November 1995, and November 1972 saw the historic moment at which the 1000 points was first breached.
So based on the graph above, I wondered how often a new record was achieved. We know that the stock market is quite volatile, but how long – as a rule – is there between the records? Five years? Ten years? The answer to that question is not so easy as you might think, for the simple reason that historical boundaries are subject to deflation: the higher the level of the index, the smaller the relative jump becomes. The Dow Jones, for example, took twenty years in the early 20th century to climb from 100 to 200 points, but the index rose by 142 points on Monday alone. In 1906, that 100-point increase would have been a doubling, but on Monday this was a movement of just 0.2%. In short: Although 100 points is a nice round and constant number, in relative terms it isn’t at all.
If I apply 100 points further as a starting point, the frequency distribution of 100 points looks as follows:
How long it took the Dow to break through the next 100
Source: Robeco, Bloomberg

The orange line here shows the absolute course of the Dow Jones since 1896 on a daily basis, the turquoise line, the period (in days, on the left hand axes) in which a new 100 is breached. As you might expect, this number of days decreases as the index continues to ratchet higher: in the 90s, almost no single year past without one or more 100-point barriers being smashed. That we had to wait for a long time for a new record in 2000-2006 and 2007-2013, has everything to do with the sharp market corrections that occurred in those periods: the dotcom crash (which was not as bad for the Dow Jones as for others) and the subprime crisis.
So choosing a fixed, round number leads to a distorted picture, with records galore at the end of the period. The first 100-point day for instance, took place in 1987 (the infamous market crash), and on 14 October 2008, we only just missed a 1,000-point day. The index rose that day by 936 points, after a loss, by the way, of 2,400 points in the eight preceding trading days.
Natural option
So an absolute, round number just doesn’t work well. Fortunately, we have a mathematical alternative on offer: the natural logarithm. This enables us to compare the 20 points from 1900 with the 200 points in 1970. The graph above then starts to look a whole lot different:
How long it takes the Dow to break through the next 100
Source: Robeco, Bloomberg

The orange line once again shows the Dow Jones, but this time as a natural logarithm. The turquoise line shows again how many days it took to breach a new historic boundary. I chose this barrier in such a way so as to ensure the first barrier would be broken on the same day as in the first graph (for the nerds: Dow Jones = 100, ln = 4.59).
As we are now comparing apples with apples, it’s striking that the crisis years now behind us only belong to the midfield in a historical perspective. Although investors had to wait from 1999 to 2013 to celebrate a new record, after the market crash of 1929 it took almost twice as long. And in the 1910s and 1970s, US investors also had to have the patience of Job before they could hang out the bunting. Purely based on this graph, a new record seems to occur once every eight years. The last record occurred in March of 2013, so that would mean we need to have a bit of patience yet. However, I’m talking here of a new record without stating what that new record actually is. There is the flip-side of using natural logarithms: they don’t give us nice round numbers. The following record will be achieved when the natural log of the Dow Jones reaches 9.957, which corresponds with the Dow at 21,108.
And I suspect that I’ll be alone in celebrating that joyous moment…

Pingback: The Trump rally | Best of the Web