Good news! The US economy looks set to deliver a strong fourth quarter! But hang on a minute…
The Atlanta Fed’s GDPNow forecast is one of my favorite US economic indicators, so I keep an eye on it. You can read here what I have written about it in the past, but essentially, this indicator is a reliable barometer of the US economy, based on all relevant data published daily, weekly and monthly. The aim is to accurately estimate GDP growth in the current quarter. Note that it’s not a prediction: as new data becomes available, such as a new retail sales figure, the estimate is adjusted to reflect it. It’s not until a month after the quarter ends, when all quarterly data is in and we’re only still waiting on the GDP figure, that it can actually be seen as a forecast. And based on the data of the last two years, the GDPNowforecast has built up a pretty solid track record, which also explains its popularity as an index.
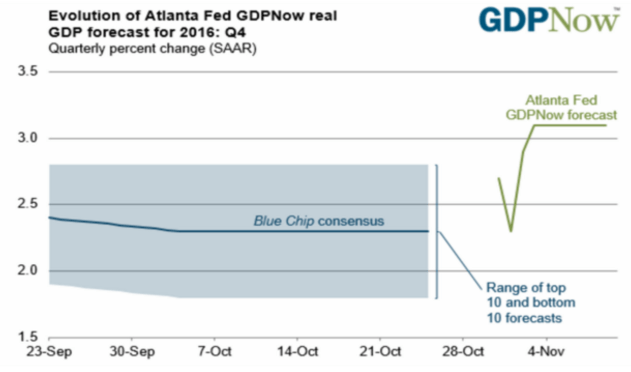
And the good news is that the fourth quarter outlook looks bright. At least, based on the available monthly data, the Nowcast puts the growth rate at 3.1% As the graph shows, this rate greatly exceeds the current consensus expectation for the fourth quarter. Well that’s a good thing, right?
Déjà vu
But the trouble is, I’m having a bit of a déjà vu. Wasn’t second quarter growth predicted to be 3.8% only six months ago? And didn’t it end up at just 1.4%? And weren’t expectations for the third quarter significantly better at the start than towards the end of the quarter? Time for an in-depth look at the data.
As the quarter progresses, growth seems to weaken
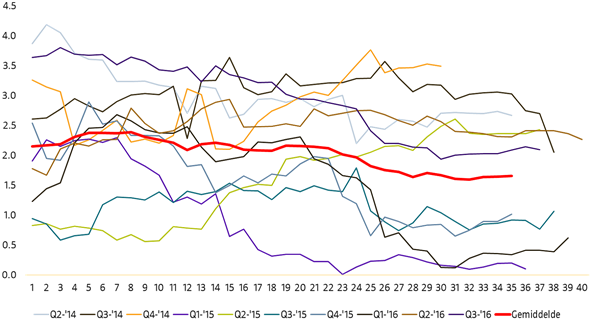
Source: Atlanta Fed, Robeco
The graph above shows the growth rate fluctuations for the ten quarters that GDPNow forecasts have been available. The thick red line shows the average fluctuation. I’m not sure why there was more data in some quarters than in others, but I suspect that it has to do with the fact that in some quarters, more data is published on the same day than in others and a coordinate is added to the graph only if new data is included. The average trend does indeed suggest that growth is at its highest as the quarter begins, only to drop off later on.
So is the data positively biased at the start of the quarter? One would think so, but it’s a bit too soon to say. After all, only in half of the cases was the end value lower than the start value: in the other five, they were either the same, or the end value was higher. The fact that the average goes down is because if there is a disappointing figure this is often bigger than figures that surprise on the upside. But the data is too limited to say whether there’s a real connection, or it’s just a coincidence.
In other words, it’s nice to know the fourth quarter is off to a strong start. But whether that means the growth rate for the quarter as a whole will end up higher or lower will depend completely on data which has yet to be published.

Pingback: Bond yields and growth | Best of the Web
Pingback: Good news for Trump! | Best of the Web