http://www.rba.gov.au/chart-pack/au-gdp-growth.html
In honor of my visit to Australia, today for a change a graph about… Australia!
In the context of our annual publication Expected Returns 2017-2021, I was asked if I wouldn’t mind coming to Australia this year to tell the story there. Australia? That’s not exactly down the road. However, they kept insisting and so it was that I suddenly found myself walking down the street in Sydney on Monday morning. Well, hardly suddenly, as I’d spent an entire day in the plane. On my birthday no less, which was some seven hours shorter than normal as I was flying eastwards.
Part of my trip involved talking to a number of journalists, so I had been warned that there might be some questions about the Australian economy. And though I’ve got some idea of the Australian economy (mining, pretty dependent on China, a housing bubble), if someone had asked me to state the latest GDP figures, or unemployment, I wouldn’t have had much to say of any sense. So there I sat, in my hotel room, with just half an hour to go and diligently looking for a decent overview of the Australian economy. A detailed country report by the IMF gave me enough background (indeed: mining, quite dependent on China and a housing bubble), but it was from September 2015, so not really up to date. My attempt to find more recent details on Bloomberg ran aground with a jittery internet connection, so I decided with some reluctance to go to the next source: the Reserve Bank of Australia, the country’s central bank. I say with ‘some reluctance’ as central banks are not usually much good at presenting simple data in a handy format, but often get stuck in the extensive analysis I’d just read from the IMF.
Exception to the rule
The Reserve Bank of Australia appeared to be the exception that proved the rule. On the main page under the heading “Latest News” was a link stating “Chart pack – October 2016”. And it gave me exactly what I expected: charts. No text, just 100 graphs that reveal the state of the Australian economy (and beyond), neatly subdivided in 16 wider categories. Even with my slow internet connection, I was able to retrieve all the graphs I needed in no time: unemployment, house prices, inflation, various interest rates, everything. Even the regional distribution of economic activity, commodity prices and IPO activity were all neatly cataloged and up to date on the site.

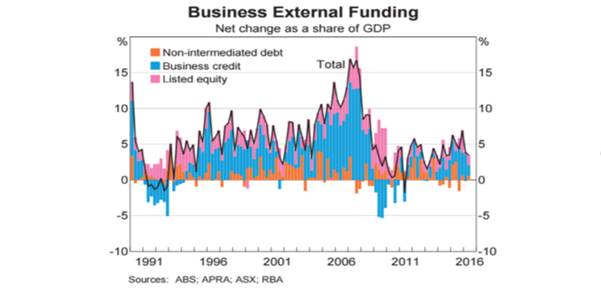
http://www.rba.gov.au/chart-pack/equity-raisings.html
Definitely worth a look. In two minutes you get a fairly comprehensive idea of the state of the Australian economy. The most striking graph was Australian GDP, the first graph in this article. The line gives the year-on-year growth of GDP, and the bars, quarter-on-quarter growth. What you notice straight away is that the Australian economy has been growing pretty much uninterrupted for 25 years. If you apply the standard definition of a recession (two quarters of negative growth in succession), Australia has not had even a single recession in 25 years. Granted, in 2000 it was a close call, but we’ll ignore that for now. What’s really remarkable is that in 2008, while the entire global economy was weathering a severe recession, the Australian economy reported negative growth for just a single quarter. And that’s all of course thanks to the direct link to China, which also kept on reporting solid growth numbers throughout this period.
Now this wasn’t much of a surprise to me, as I’d seen it all before at some point. After a little searching I did indeed find the table I was looking for: an overview of the longest expansion phases in the world. Although the table is a little out of date, calculated from the second quarter of 1991, Australia has now had 101 quarters without a proper recession. That means the country is just two quarters away from taking the title of longest expansion phase on record. So who currently holds that title? The Netherlands!
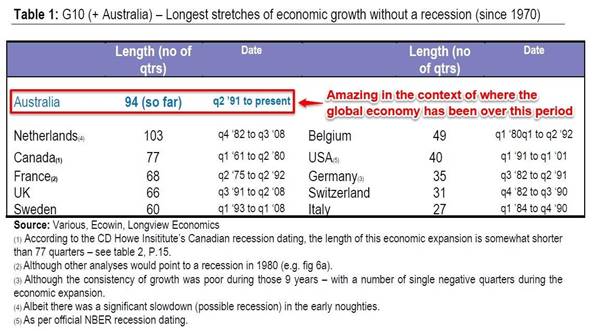
If you think this is all just facts for nerds, you’d be mistaken: in most conversations I’ve had in Australia, they love to mention it: “almost the longest expansion on record, mate!” Few are aware that the Netherlands is currently the record holder, but they’re very clear on one thing – in just six months they can hang out the bunting.
Now let’s just hope that China doesn’t suddenly face a severe downturn…
