Source: Robeco & Bloomberg
Remember 2017? One of the most boring years on record in terms of market volatility? A record low in the VIX Index (a measure of expected volatility in US equities), a record low in the MOVE (the same but for US bonds), hardly any movement in the investment grade market (corporate bonds with a high credit rating) and almost no movement in high yield? The contrast with what we have seen in 2018 couldn’t be starker: collapsing equities, Facebook down 20%, uncertainty everywhere and markets trading between hope and fear. Right?
Well, no. Wrong, in fact. Sure, equities have been pretty volatile: the major international indices have zigzagged to the rhythm of trade wars, Trump tweets and FANG troubles (Facebook, Amazon, Netflix and Google) and the MSCI World Index has closed at least 1% higher or lower on 15 occasions so far this year (five times more than was recorded for the whole of 2017). But while the zigzag nature of the market means that on balance the damage is still relatively limited, most stock indices are in the red for the year to date.
Remarkable calm in financial markets
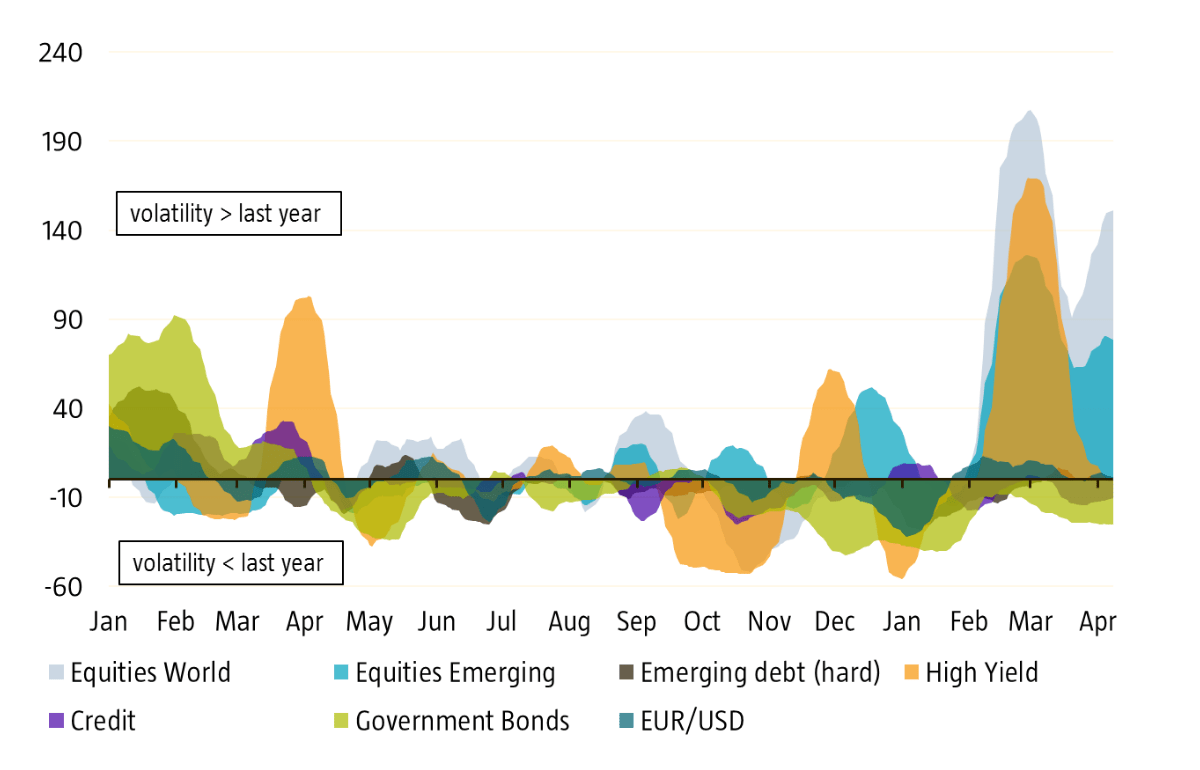
But here’s the thing: the volatility is almost entirely restricted to the equity markets, which is what this week’s chart shows. What we see is the four-week rolling volatility for each of the major asset classes relative to the respective average volatility recorded in 2017. If we take high yield as an example, whenever the orange area is above zero, it means that the average daily volatility has risen above the average seen in 2017, while a negative reading means that volatility is actually below that recorded last year. As you can see, while high yield volatility did spike in February, it was just a one-off: the current volatility is exactly in line with the low volatility recorded in 2017. High yield is by no means as affected by trade war fears as equities appear to be. This conclusion is confirmed by the credit spread (the compensation for credit risk taken) you can earn in this market. Whereas this spread was 3.4% at the start of the year, it has now risen to 3.55%. As a point of reference: the long term historic average (median) spread currently stands at 5.3% (4.75%), while the credit spread at the beginning of 2017 was 4.6%. In other words, the 0.15% spread widening compared to the start of the year is peanuts.
The plot thickens when you look at the other asset classes. US bonds, credits and emerging markets bonds (HC) have so far all traded at lower volatility compared to last year’s averages. Even the euro-dollar exchange rate seems to have settled into a fairly stable trading range, responding marginally to the trade war rhetoric and turmoil seen in equities.
To show how remarkable the current mismatch is, here is a second chart that focuses specifically on the relative (implied) volatility between US equities (VIX) and US government bonds (MOVE). This chart shows the VIX/MOVE ratio, i.e. the movement of relative volatility in equities compared to bonds. If this line rises (falls), equities are more (less) volatile relative to bonds. All the previous spikes are linked to historic events like the Asian crisis, the collapse of LTCM, 9/11, the subprime mortgage crisis and the euro crisis. The chart clearly shows that the ratio has spiked to the highest level on record.
The biggest volatility decoupling in over 25 years

Source: Robeco & Bloomberg
Why is this odd?
So why is this odd? Well, normally volatility spreads across the various parts of the financial markets. Financial markets are connected through various channels. Volatility in oil prices leads to uncertainty in stocks, with equities and high yield normally showing similar trends if the underlying earnings outlook is impacted. And a sell-off in equities normally leads to a so-called ‘flight to safety’, with investors selling equities and buying bonds: bad days for equities thus become good days for bonds and vice versa. Volatility in one market creates volatility in others.
So, has there been no flight to safety this time around? You could indeed draw that conclusion by looking at the movements of the US Treasury yield. If we take the high in the S&P 500 on 26 January as a refence point, US stocks have lost around 10%. During the same timeframe, the 10-year bond yield has risen from 2.65% to its current 2.80%. That’s not to say that US bonds have not experienced support on big S&P 500 down days, but these gains have been smaller than normal and only temporary. The following chart shows that there has indeed been a shift among investors into the US bond market (the rising blue line), but that this has not had a knock-on effect on yields. This is most likely linked to the fact that the supply in the Treasury market has picked up significantly during this period: not only is the Federal Reserve reducing its position in the Treasury market, Trump’s tax plans have increased the amount of money the current administration needs to borrow in the market. More demand + more supply = limited price reaction. The alternative explanation is that bond and currency markets are simply uncertain what will happen next, and are therefore dismissing all the rhetoric as noise.

To be honest, I’m a bit suspicious of both the coincidental matching of supply and demand, and the ‘turn a blind eye’ storyline. It is much more likely that volatility will start to move in sync across the markets again. Whether this move translates into higher equity volatility or lower non-equity levels is something we will find out before long.
