Source: Robeco & Bloomberg
It may not have been presented as such at the time, but when US Congress approved plans to overhaul the tax system at the end of last year, it embarked on a macroeconomic experiment which will probably set tongues wagging for decades to come. This week’s chart is the simplest way to show what that experiment is all about.
Before we home in on the chart, let’s consider the background to the imminent tax overhaul. It was presented as the most radical overhaul of the US tax code on record and, despite Trump’s habit of – let’s be politically correct about this – overemphasizing things at times, it is indeed a pretty big one. The highlights include permanently lowering the corporate tax rate from 35% to 21%, cutting most income tax brackets (until 2025) and lowering barriers to the repatriation of foreign earnings (which effects a total of USD 2.6 trillion in assets). In short, tax cuts for all: for companies, the wealthy, and everyone else (in that order).
Good for the taxpayer, bad for the deficit
Originally, these plans were presented as being more or less neutral in terms of their impact on the overall government deficit as a percentage of GDP, since the tax reduction would boost GDP growth and thus finance the whole operation. As time went by, however, the Trump administration acknowledged that the initial effects of these plans would push up the deficit. Looking at consensus data from Bloomberg, the deficit is expected to rise to 4.5% of GDP in 2019, while financial institutions like Morgan Stanley, Citigroup and Bank of America are even forecasting 5% or more.
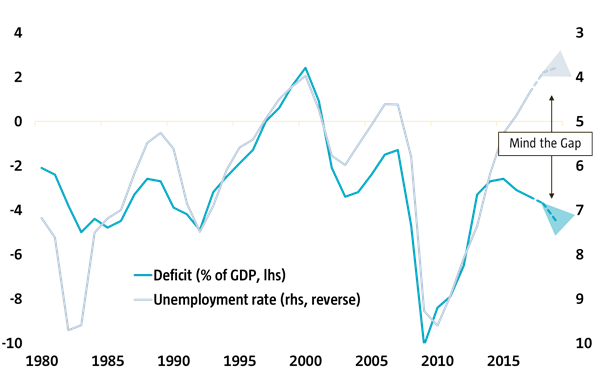
This brings us to the chart. The blue line shows how the deficit has evolved over the years (left-hand axis). Since 1980 the average deficit has stood at 3%, but what we also clearly see are wide swings. At one end of the spectrum, surpluses in 1997-2001 (primarily thanks to a Republican-dominated Congress towards the end of the Clinton presidency), and at the other end a deficit of up to 10% during the Great Recession of 2009. So 5% is not unheard of.
Enter the second line. This shows the movement of the US unemployment rate during the same timeframe. This line is shown in reverse: a rise represents a drop in unemployment and a decline means that unemployment was on the rise. It is presented like this so you can see that there is a pretty strong connection between the two lines. Which is no real surprise. When an economy is doing well, unemployment declines, more people earn an income, and companies report higher earnings, which drives up tax revenues. But when an economy is hit by recession, unemployment rises, profits slump and tax revenues decline.
Weird macroeconomics
Which brings us to the experiment. As said, a deficit of 5% (or more) is not unheard of. However, it is clear from the chart that such a high deficit only happened when unemployment rates were up and rising. In 1983 (Reagan) unemployment reached 9.6%, in 1992 (Bush) it rose to 7.5%, and in 2009 (Obama) it hit 9.6%. It was the economy that pushed the deficit to such high levels. This time round, the unemployment rate is close to reaching its lowest level in 40 years, while the economy is in fine shape. This time round, it’s not the economy that’s driving the deficit; it’s Trump.
Is this a wise policy move? Well, no. Economic theory tells us that stimulating an economy that is already running at high speed is not a very sensible thing to do. The aim of the tax cuts is to increase demand for goods and services, which need to be produced somewhere. If the economic pedal is already to the metal, doing so could pose serious challenges. Either your economy will overheat (triggering a wage/price inflation spiral) or you’ll end up having to import the goods and services from abroad (also known as the ‘twin deficit’). Given Trump’s obsession with the US current account deficit, this is probably not what he’s hoping for.
So, are we heading for a US disaster? Not necessarily. Economic theory is by definition just that: theory. Whether this will all end in tears depends crucially on the level of slack still present in the US economy. Trump seems to assume that there is plenty, despite the fact that unemployment is already down to 4%. The US economy has managed to grow 4% and even 5% in the past, so why shouldn’t it this time? I can think of plenty of reasons. But hey, I’m not Trump.
Time will tell whether this experiment is a success or a disaster.
