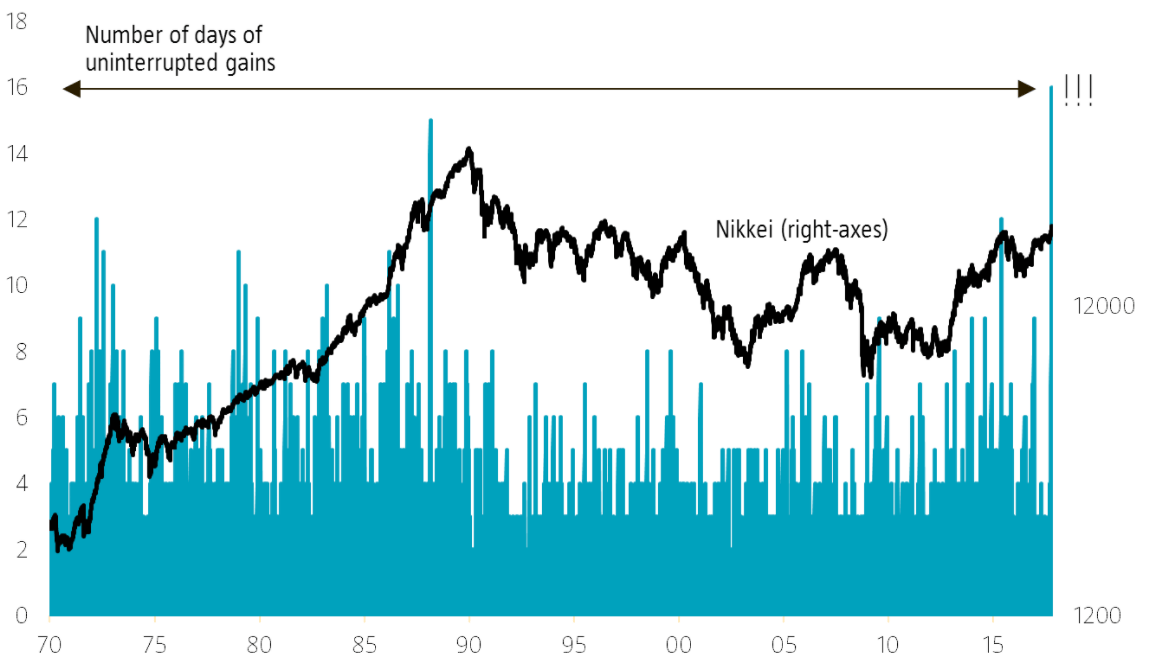
The Nikkei managed to close higher for 16 consecutive days. Impressive, or not?
Investors have gotten themselves quite worked up in the last couple of weeks about the ongoing rally in Japanese stocks. Solid economic figures, a weaker yen, Abe’s election victory, good earnings numbers: everything was going the Nikkei’s way. This rally of 16 consecutive days was the longest on record for the Nikkei, but I should, however, immediately add that records in this case only date back to 1970. For a while it even looked as if the record would stretch to 17 days until afternoon trading on Wednesday the 25th threw a spanner in the works. So we had to start all over again.
Rather exceptional
But exactly how exceptional is a rally of 16 consecutive days? If I restrict myself to the broader, local equity indices, it does seem pretty exceptional. It places the Nikkei in an exclusive group of just ten indices, out of around 40 that I have looked at going back to 1970, that have managed to achieve a similar run. One thing you notice immediately is that while the Nikkei closed higher for 16 consecutive days, the Japanese Topix managed a run of ‘only’ 12 days. The difference between the Nikkei and the Topix pretty much equates to the difference between the Dow Jones and the S&P 500 indices in the US: the first is a bit of a Mickey Mouse index, while the other is a far better representation of the broader equity market. So we shouldn’t get too carried away.
16 days of consecutive gains puts you in the top ten

Source: Bloomberg, Robeco
So sixteen days is indeed pretty impressive. The absolute record is held by Shanghai which allegedly managed to book 99 days of consecutive gains in 1991-1992. I say allegedly because the price moves I see on Bloomberg for the period hardly resemble normal market movements. During this rally, the daily market upward movement was capped at a maximum of 1% and only when this restriction was lifted in February 1992, did the negative days reemerge. All artificially controlled, so you can’t really call them ‘market’ movements. The number two position also goes to Shanghai but is just as dubious. Next on the list in third place is the Saudi Arabian market which rose for 20 consecutive days in September 2003. Without resorting to the term Mickey Mouse for the second time, I will simply say that only in fourth position do we encounter a real market: In 1979 the Nasdaq closed higher for 19 consecutive days.
Rather meaningless
Of course this is all rather meaningless. The Nikkei’s gain on 11 October amounted to just 0.06%, while on the following day it only managed to edge up by 0.01%: if it had ticked down at the close, there would have been no talk of records. Conversely, if we take a decline of 0.1% as a margin of error (and so don’t count that as a correction), the Nikkei’s rally in 1971 actually lasted 22 days: bye-bye record.
It is also nice to look at which of these runs of consecutive highs generated the most gains for investors. The weird Shanghai event aside (funnily enough the 99-day rally also delivered 99% in market gains…), if you look only at the records where markets generated gains for 14 consecutive days, I end up with the following summary.
Gains per rally differ considerably

Source: Bloomberg, Robeco
The 7% gain that the Nikkei racked up in the last 16 days is not particularly special from a historical perspective. There is again more to it than meets the eye. For example, the best score for market gains per plus day goes to the Brazilian Bovespa, which in 1994 rose 19 and 15 days consecutively and posted gains of an impressive 86%. But if you consider that Brazilian inflation in 1994 peaked at around 5000%, it’s clear that this was no normal rally. In fact, over the entire year, the Bovespa rose by only 1000%, so in real terms, investors actually suffered considerable losses. Of all the markets in the summary, the Nasdaq had the smallest market gains per plus day: in the 14-day rally in 1987, it registered a paltry 3.8%.
The real question is of course what follows such record consecutive gains: is the optimism then cruelly punished, or are there a couple of down days before a further strong rally occurs? If I filter out the less representative examples like the Bovespa and the Shanghai index and look at returns in the three weeks that followed the end of a record run, I end up with an average return of 1.8%. The biggest negative result was recorded by Saudi Arabia (-4.6), while the Nasdaq achieved the biggest positive result (13.3%)
And Japan? The Japanese market was, on average, 2.5% higher after three weeks. But beware: this positive scenario is significantly affected by the positive outliers in the Japanese market of the ‘70s. The Topix that is, not the Nikkei.
