https://www.bespokepremium.com/think-big-blog/the-least-exciting-record-ever/
The US stock market is behaving a bit like something is broken. It hardly moves from one day to the next. So what is wrong? Or do we actually have reason to celebrate?
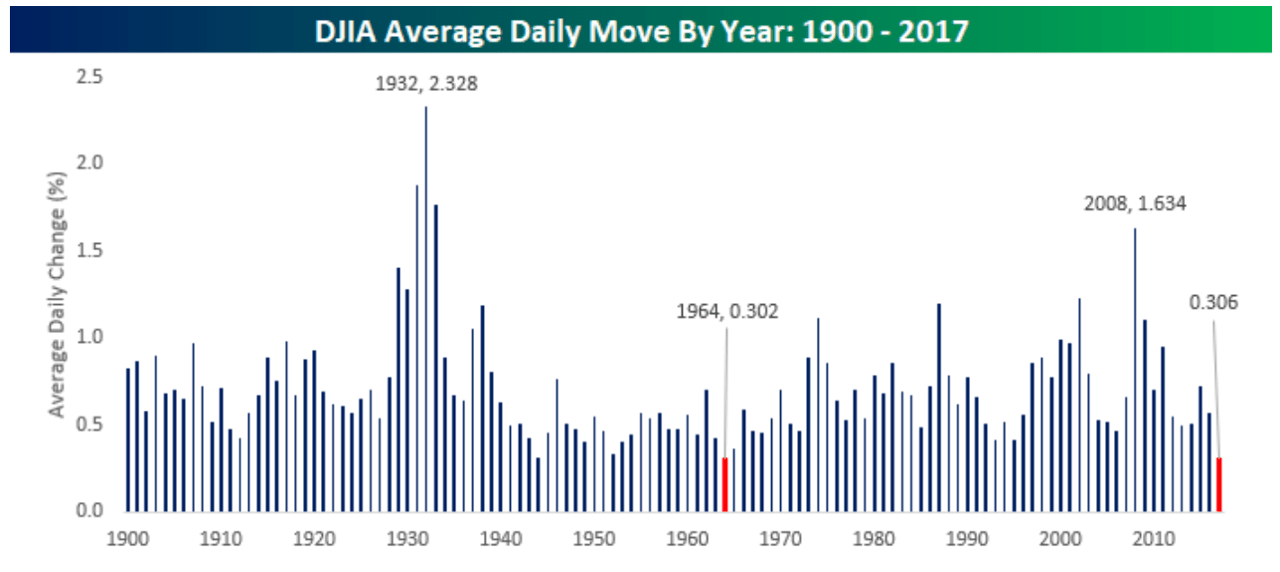
Rarely has the US stock market been as boring as it has this year. Or at least, that’s the message of the graph above. What it shows is the average daily changes on the Dow Jones for each year going back to 1900. In this case, it doesn’t matter if the change is positive or negative, as the graph is looking only at the absolute change from one day to the next. Since 1900, the average daily change is 0.713%, which means that if the Dow Jones closed 0.7% higher or lower today, that would actually be perfectly normal. Sure, but if you look at the figures, you see that the US market hasn’t shown such a ‘big’ movement for the entire last month: on 11 September, it closed 1.2% higher. Ever since, the changes, whether upwards or downwards, have been only tenths of percentage points and sometimes just mere hundredths. All in all, since the beginning of the year, there have been only 17 trading days on which the Dow Jones moved more than the long-term average. In fact, according to the graph, this year the daily volatility has averaged just 0.306%, which is pretty close to the all-time low recorded in 1964. The message is clear: the stock market is utterly boring.
Viewed from a more critical perspective, it might not be such a fair comparison. In each case, the bars show the annual average, which of course, is not yet available for 2017. Ask any stock market expert and they will tell you that historically, October and November tend to be volatile, so perhaps we are jumping the gun. While that’s certainly true, it doesn’t end up affecting the annual averages all that much. The graph below is the same as the one above except that for every year I only used data going up to 12 October to calculate the averages. Though 1964 still holds the record with 0.22%, we now see that 1944, 1952 and 1965, with 0.24%, 0.26% 0.29%, respectively, are still lower than this year’s figure of 0.31% when it comes to a low level of volatility. Incidentally, 1963 holds sixth place in this graph, which means that the period from 1963 to 1965 must have been very dull indeed. Apparently not even Kennedy’s assassination and the Vietnam war had any impact worth mentioning.
2017 isn’t number two, but it is in the top five

Source: Robeco
What nonsense!
But wait a minute: of course people don’t invest their money in the stock market because they hope to lose some of it tomorrow? It’s because they want a return, right? Why all the bellyaching about low volatility levels? Who cares anyway, when the stock market is worth over 10% more than it was at the beginning of the year? Actually, there’s nothing better than a stock market that rises, slowly but surely, to build up to a nice return, right?
As it turns out, good returns and low volatility levels often go hand-in-hand. In the graph below, I’ve plotted the annual returns on the Dow Jones against the volatility levels shown above. While the correlation isn’t perfect (the points don’t form a straight line), it’s hard to deny that there’s some kind of relationship going on. The major outliers, 1915 and 1933, were both years with reasonably high returns as well as relatively high volatility levels. In both years, the market was recovering from a substantial correction in the years before.

Source: Robeco
In case you’re not sure how desirable it is to have low volatility levels, then maybe you should hear what the Bank of Japan (BoJ) is doing about it. This week I came across an analysis of the effectiveness of the BoJ’s policy. As you may already know, the BoJ doesn’t only buy bonds, it also owns a growing share of the Japanese stock market: it currently holds more than 3% of Japanese stocks, and according to the analysis, this figure is set to increase to 10% over the next five to ten years. So what’s their goal? Apparently it’s “Lowering risk premia of asset prices”. So if even a central bank is trying to lower volatility levels, why are we all whining about a humdrum stock market?
Or is it?
Lest you start believing I am happy that volatility is seemingly on its last legs, let me just say: anything but. I most definitely see the risks of the currently low volatility, which is why I also have serious doubts as to the prudence of the BoJ’s policy. We must never forget that investing has risks and that is something that people are slowly but surely losing sight of in a year in which the stock market appears to be gradually moving upwards. The evidence is not just anecdotal: many professional investors have a risk budget, where expectations for risk are generally assessed on the basis of historical volatility. Other investors scale risk up and down depending on the level of the VIX index. If the VIX is high, then risk is limited, and if it’s low, as it is now, the positions are scaled up. That works well, as long as volatility remains low, but once the trend reverses, it can trigger a self-perpetuating process. In that scenario, a drop in the stock market is what triggers investors to start reducing their positions, which increases the sales pressure in the market.
Investors need to be aware of the risks they are taking. That’s why every now and then, it’s necessary to have a bit of movement in the market.
