Amid a looming war with North Korea, stalled tax reforms and Trump threatening to annul trade agreements, the S&P 500 seems suspiciously unfazed…
It’s well known that stock markets tend to have a positive take. One familiar example is how they behave in a recession. Naturally, when the economy starts contracting rather than growing, stocks go down. But then the market always seems eager to demonstrate its ability to bounce back again. An average of three months before a recession ends, stocks will typically show a sudden upturn. Although macroeconomic figures often still point to an ongoing contraction, the market has already priced this in and bottomed out. This is referred to as ‘climbing the wall of worry’.
It’s worth noting that such optimism is not unique to recessions. Trump wins the election? There will be tax cuts, so it’s great for stocks! Trump threatens to shut down the government if it won’t fund the wall with Mexico? Great bargaining chip: certainly better than starting a trade war! Trump demands trade tariffs? Don’t take him too seriously. He won’t get it through Congress, anyway. So it’s great for stocks! I admit, I may be exaggerating a bit, but in the last six months, I have actually seen this kind of reasoning being used, though not always by the same people.
Mind you, I’m not saying the US markets just ignore the news. There were two days in August in which the S&P lost around 1.5% due to the mounting tensions surrounding North Korea. In both cases, however, it quickly bounced back: bargain hunters entered the market, rapidly bringing it back to its previous level. In spite of Donald (a.k.a. ‘I-want-tariffs’) Trump’s statements and North Korea’s antics, this week the S&P 500 closed at a new all-time high.
US stocks are expensive!
On the face of it, there’s of course nothing wrong with this. Ultimately, a company’s growth and profit outlook are what really matter when it comes to valuation and as long as there are just ominous headlines and no concrete measures or real consequences, what’s not to like? The global economy will keep humming along and inflation – typically considered a troublemaker – won’t be a concern. So why should stock prices fall?
Erm, well, because they’ve gotten too high? Let’s not forget that the markets have behaved optimistically for much longer than just the last six months – they’ve been like that for over eight years. Whereas they initially seemed only to be compensating for excessive pessimism (the markets can overreact in both directions), in recent years, US stock prices have consistently risen more quickly than underlying earnings. So the markets are consistently pricing in higher earnings. That’s not to say they won’t eventually materialize, but the gap between stock prices and earnings is starting to look more like a gaping hole.
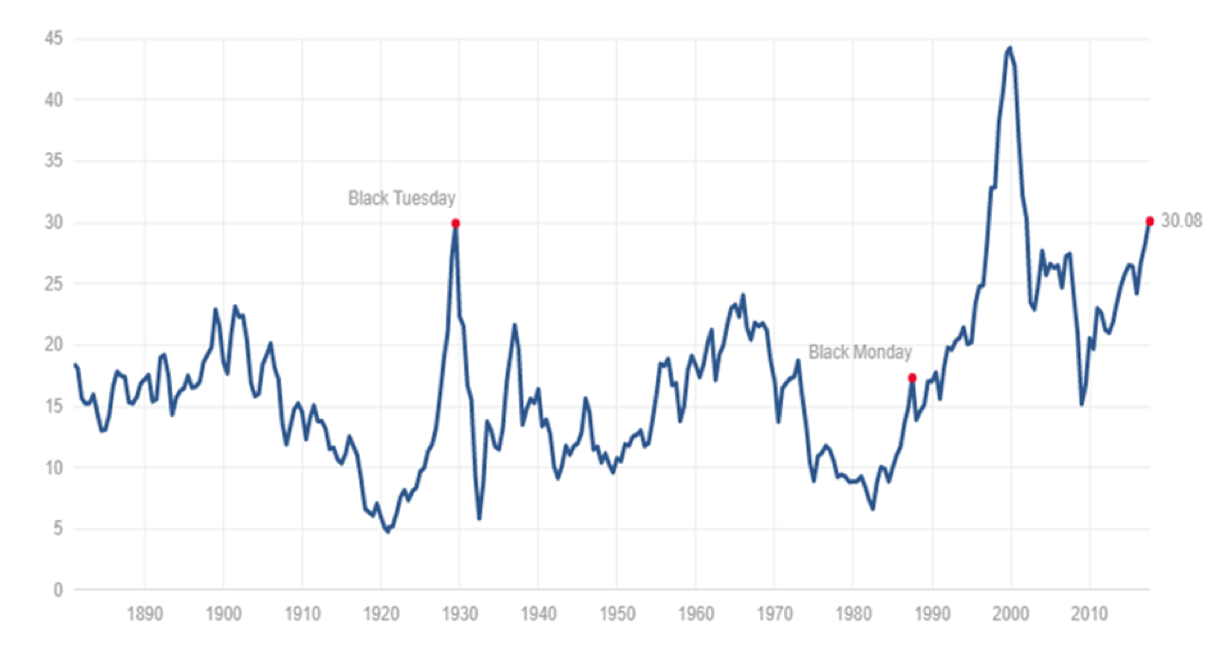
The measure most commonly used to show that stocks are overvalued is Robert Shiller’s price/earnings ratio, also known as the Cyclical Adjust Price Earnings (CAPE) measure, or simply ‘Shiller PE’. Unlike the usual price/earnings ratios, the Shiller PE doesn’t look at expected profits or the last year’s profits, but the average over the last ten years in real terms. The reason why Shiller uses such a long timescale is to smooth out the volatile nature of earnings and create a more stable picture. The graph above, which shows changes in the Shiller PE over time, leaves little to the imagination. There are clear outliers indicating the major stock market bubbles of 1929 and 2000, and the damage they left in their wake. In fact, the level of the Shiller PE is now suspiciously close to where it was during the 1929 crash, which back then marked the start of the Great Depression. According to this measure, the only time prices were higher was during the 2000 Internet bubble… which is indeed worrying.
Rose-colored glasses
Leave it to the stock market pundits, with their unrelenting optimism, to put a positive spin on this, too. Certainly, 30x seems high and looks intimidating, but in this case, there is an automatic improvement in the pipeline. As mentioned, the Shiller PE looks at the real earnings of the last ten years, thereby supporting the positive spin: it was ten years ago that the crisis struck and US earnings took an unprecedented hit. Based on the Shiller figures, real earnings dropped a staggering 92% between June 2007 and March 2009. On a graph it looks like this:
Over the next two years, that decline in earnings will fall out of the equation

http://ritholtz.com/2017/09/u-s-stocks-set-become-less-pricey/
The extremely low earnings figures are currently all still being included in the Shiller PE, but will gradually fall out of scope over the next few years. In other words, even if earnings do not grow appreciably in real terms during that time (which seems a bit pessimistic), the Shiller PE will decline ‘naturally’. The graph below shows the level of the Shiller PE until 2021, if earnings remain constant:
Shiller PE: 30 or 25?

Source: Robeco, Shiller
In short, whereas pessimists view a Shiller PE of 30x as a sign of impending disaster, optimists (=the stock market) would probably use a different price/earnings ratio. Though it’s not the true Shiller PE, this adjusted Shiller PE (which actually looks at earnings over the last six years, rather than ten) stands at a ‘mere’ 25x. Even in historical terms, that’s still high, but likely not alarming enough to stop stock prices from rising.
Incidentally, each year Robeco publishes a five-year outlook on the financial markets, which looks at more than just the Shiller PE. The graph below was taken from that publication. Other valuation measures also suggest that the US market is currently overvalued.
Other measures also suggest that the US market is overvalued.

Source: Robeco Expected Returns 2018-2022

Pingback: Yikes! US stocks are expensive! | Best of the Web