http://theirrelevantinvestor.com/2017/07/27/a-few-charts-and-a-few-thoughts-3/
Compared to equities, bonds are boring, generating stable returns. Or aren’t they?
Ask any financial analyst to tell you a story about what happened on financial markets over the last week, and you’ve got a good chance that you’ll mostly hear a yarn about equity markets. For sure, the euro or the dollar will be squeezed into the end of a sentence, and somebody will probably be mumbling about capital market rates, but first and foremost it’s equity markets all the way. People can hardly be blamed for thinking that equity markets are so vitally important. Yet, if we compare the volume of equity markets to the size of the bond markets, we cannot but admit that they are both almost equal in scope. The graph below shows the subdivision of all listed investments in the world, with the blue segments reflecting equity-related assets and the brown/orange areas indicating bond markets. So, a clear 50-50. Actually, the daily trading volume on currency markets is still many times greater than the turnover on both equity and bond markets combined, and we’ve not even mentioned derivatives. So equity markets are basically just a minor part of a much greater whole.
volumes on equity and bond markets are comparable

Still, you don’t hear that much about bond markets and the reason will not come as a surprise – they are rather boring. Whereas equity markets sometimes move several percentage points in a single day, bond markets are often limited to just a few tenths of one percent. The average daily change since 1998 of an investment in a well-diversified basket of European bonds, for instance, is just 0.18%, whereas over the same period the STOXX50 showed an average daily variation of 1.05%. The biggest minus-day in European equities during that period was -8.6% (the day of the Brexit result), but in bonds this was just -1.6% (March 1998).
The above seems to beggar a question or two: surely we’re talking about interest-rate levels when it comes to bonds? There’s no comparing between interest rates and equity markets, is there? When referring to bonds, it is indeed common to talk about the level of bond yields, but below the surface we’re talking about the same thing: returns and the value development of the underlying investments. We look to the AEX for instance when talking about equities, but you also have comparable indices for bonds, with names like the Barclays EuroAgg Treasury Total Return index or the Citi Netherlands GBI LCL. There is probably a second reason why we never talk much about bonds: “The Barclays EuroAgg Treasury index fell today by 0.08%” doesn’t exactly sell newspapers.
But what’s so terrible about boring?
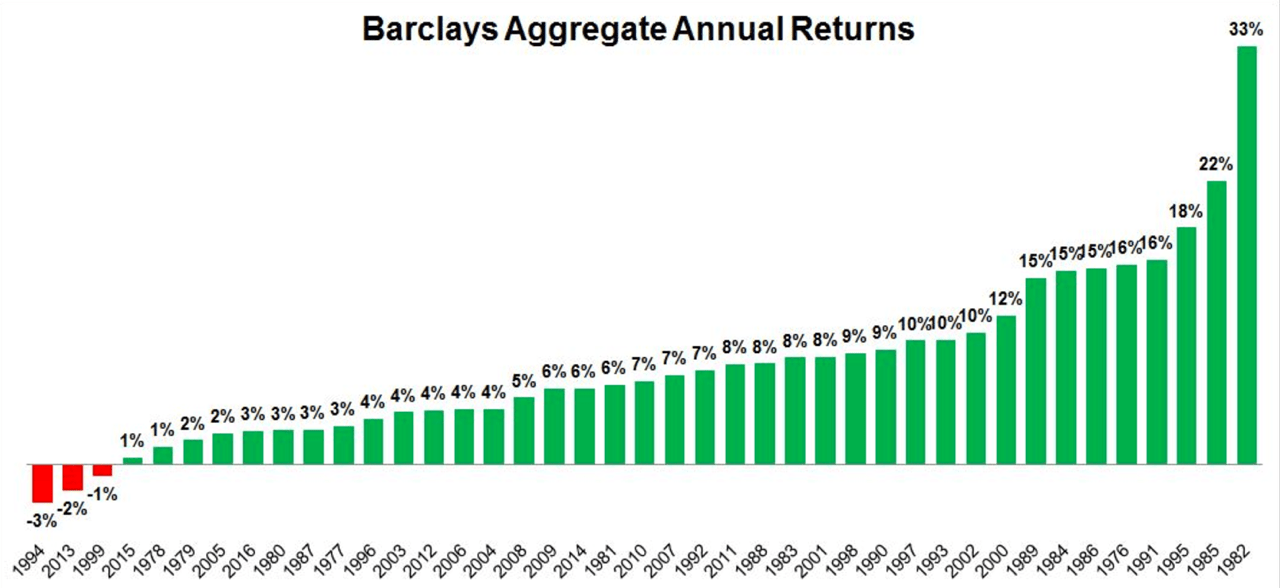
Now we arrive at the graph itself. It’s the first in a series of graphs from a blog by Michael Batnick, head of research at Ritholtz, a well-known US asset manager. This graph shows the annual returns that you would have earned if you had invested in bonds. You probably find it boring, but looking at the overview, there’s nothing to be ashamed of: the worst year would have lost you just 3%, but the best year would have generated 33%. Although you would have generated higher total returns with an equity market investment over the same period, you’d have to deal with the sleepless nights triggered by crashing markets.
Time to jump into bonds then? With capital market rates of just half a percent, you’ll not hear me recommending that anytime soon. The saying that ‘past performance is no guarantee of future results’ probably applies to bonds more even than to equities. Though you can be fairly sure that, with interest rates at 5% over a longer period, your return on bonds will be somewhere in the region of 5%, it is also clear that with a capital market rate of 0.5% you won’t be earning much more than 0.5%. The days when you could enjoy 5% per year carefree and without trading are clearly long gone.
The graph above might look pretty impressive, but as the blog’s author correctly observed, this is also a graph that looks back to a period of relative calm and very favorable inflation developments. The real bloodbath on bond markets occurred in the late seventies and the eighties, and – what a coincidence! – the first graph starts in 1982. This is not a case of malicious intent and misleading information, by the way: the main problem is that there are very few reliable bond indices that begin before 1980.
However, we do have the historical number of capital market rates, so based on certain assumptions we can construct a reasonably reliable Total Return index. And if we do that, the maximum drawdown graph for US bonds month-on-month looks as follows:
Losses of 10% do indeed occur

Source: Shiller & Robeco
It seems like this graph deviates from the first one, as we see a number of 10% losses during the period 1985–2017. However, many of the periods of loss were just temporary in nature, with most of the losses being recovered by the end of the year. The maximum loss since WW II is 15%. That might sound like a lot, but it pales in comparison with the -57% we see on the S&P500 in that period.
For those of you who find comfort in this, I’d like to show you one last graph. Whereas the graph above shows the maximum loss in nominal terms, it is actually more relevant what the returns and losses are in real terms: what you can buy with your invested dollar or euro at the end of the day. In real terms, the maximum drawdown graph looks like this.
In real terms, the bond market almost looks like an equity market!

Source: Shiller & Robeco
The combination of high inflation during and after WW II (18%!) and the Federal Reserve’s policy of keeping capital market rates low (below 3%), led bond investors to suffer substantial losses in real terms, with the two oil crises in the seventies being the proverbial final nail in the coffin. In real terms, the maximum loss was 60% and you would have had to wait another 48 years to finally reach break-even.
Always a great graph to show anyone who claims that bonds are such safe investments. ☺
