Source: https://www.businessinsider.nl/stock-market-compared-to-pmi-2017-5/
As it turns out, it isn’t actually impossible to predict stock market activity despite exaggerated claims to the contrary. Or is it?
Predicting stock market activity is extremely difficult: you just need to take a look at the daily volatility to understand that. To take the S&P 500 as an example, the average daily change in the S&P 500 since January 2000 has been 0.83%. In other words, if I had bought the S&P 500 on any given day over the last 17 years and sold it the day after, the average difference would have been 0.83% higher or lower. That average has of course been a bit skewed by results like the 9.0% loss recorded on 15 October 2008 or the 11.6% gain posted two days before, but even so, you’d be hard pressed to convince anyone that the stock market is anything other than fairly volatile. The median, for instance, is 0.55%.
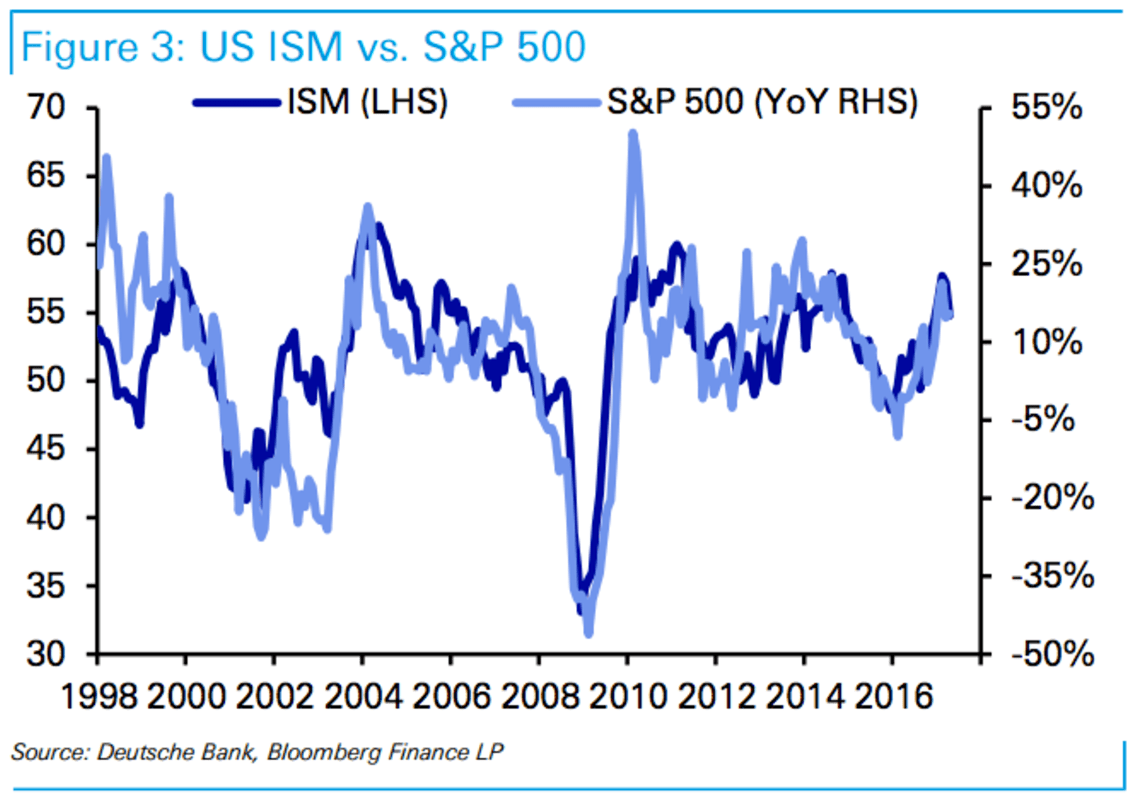
If results vary that much from day to day, how can you ever make meaningful predictions about the longer term? On the face of it, that seems next to impossible. However, this week’s graph suggests it’s not actually as hard as it might seem. The graph shows the year-on-year price movement of the S&P 500 (light blue line with y-axis on the right) compared to US producer confidence (dark blue line with y-axis on the left). While day-to-day prices seem to fluctuate a lot, if you look at the changes on a weekly, monthly or yearly basis, the stock market actually does show some degree of predictability. When you cut out the noise of daily fluctuations, what remains is the rather mundane observation that the stock market does not actually have a mind of its own, but is driven by economic forces like growth, inflation and − as shown here − producer confidence. There’s no doubt that the stock market can at times react prematurely or excessively, but in the long run, it all seems to be pretty logical.
A critical look
It looks convincing enough, and the relationship makes sense. So is there cause for celebration? Probably not. In fact for me, the alarm bells started to ring as the graph − quite arbitrarily − seems to start in 1998. I know the S&P 500 has existed for much longer and they’ve been keeping ISM records since 1948, so there must be another explanation. I’ve included a similar graph below, but for the years 1980 through 1998.
Never trust a graph with a random starting date…

Source: Robeco & Bloomberg
As you can see, 1998 was chosen for a reason: in the 1980s, the relationship between producer confidence and price performance was way less convincing. That was partly because of the 1987 crash, which caused the black line to plunge, but left the US economy relatively unscathed. Back then, the US economy was much less ‘financialized’ and so the crash did a lot less actual damage. These days, that would likely be a different story. Between 1994 and 1995, we don’t see a strong relationship either, possibly because of the huge correction that took place in the bond market at the time. In short, a relationship does exist, but it hasn’t always been a very strong one. And if the bond market is also a factor that can have a disruptive effect, then we have to allow for that in the future, too.
So what use is this?
Does this in any way help us to predict stock markets? Although it is comforting to see the link between producer confidence and stocks, it should be stressed that we are looking at a simultaneous connection, not one with predictive power. By switching from predicting producer confidence rather than stock market movement, you simply shift the problem, rather than make it any easier to solve. In other words, tell me the level of producer confidence at the end of the year and I can estimate to a reasonable degree of certainty where the S&P 500 is at. This graph doesn’t provide evidence of cause and effect, either: does the stock market go up because producer confidence is strong, or does a robust stock market improve producer confidence? And let’s not forget that it is comparing a level (producer confidence) with a change (year-on-year S&P 500), which statistically speaking, is always a bit questionable.
Let me clarify that last point. I calculated the relationship between the ISM and the S&P 500 based on data from the years 2000 through 2017. With this figure, I can now make a prediction for the year-on-year change of the S&P 500 based on the level of ISM. At the current ISM level of 54.8, the year-on-year return on the S&P 500 is 13.7%. Given the static relationship, this applies all the time: as long as the ISM holds steady at 54.8, my calculated year-on-year gain will always stay at 13.7%. Although a 13.7% return sounds pretty OK and in fact an ISM of 54.8 is also pretty bullish, an unchanged ISM of 54.8 would initially mean you would lose money. This may sound odd, but it is linked to the fact that the S&P 500 is currently already 15% higher than last year: we need to move back to a 13.7% gain, which means that stocks will have to decline from this current level. In other words, your performance is largely down to what’s happened in the recent past, rather than what’s going to happen in the future. Only when your predictions involve a longer period, does the future become more important.
Incidentally, I’m willing to believe you could use this relationship to your advantage, as long as you don’t take it too literally. The idea that the stock market will remain relatively strong as long as the economy continues growing and producer confidence is high, is not all that outlandish. But that the S&P 500 will end the year at 2220 because the ISM is at 50? I wouldn’t bet my life on it.
