It is the end of January and we are right in the midst of the so-called earnings season; the period in which all listed companies report not only their quarterly earnings, but also their annual figures. Traditionally US companies attract the most attention. This is not only linked to fact that the US economy is the most important in global terms, but it is also because US companies are much faster at publishing results. Not that the results of an ING or AstraZeneca are not important, but it’s all a little less high profile and the results come out slightly later than leading US companies like Apple and Amazon.
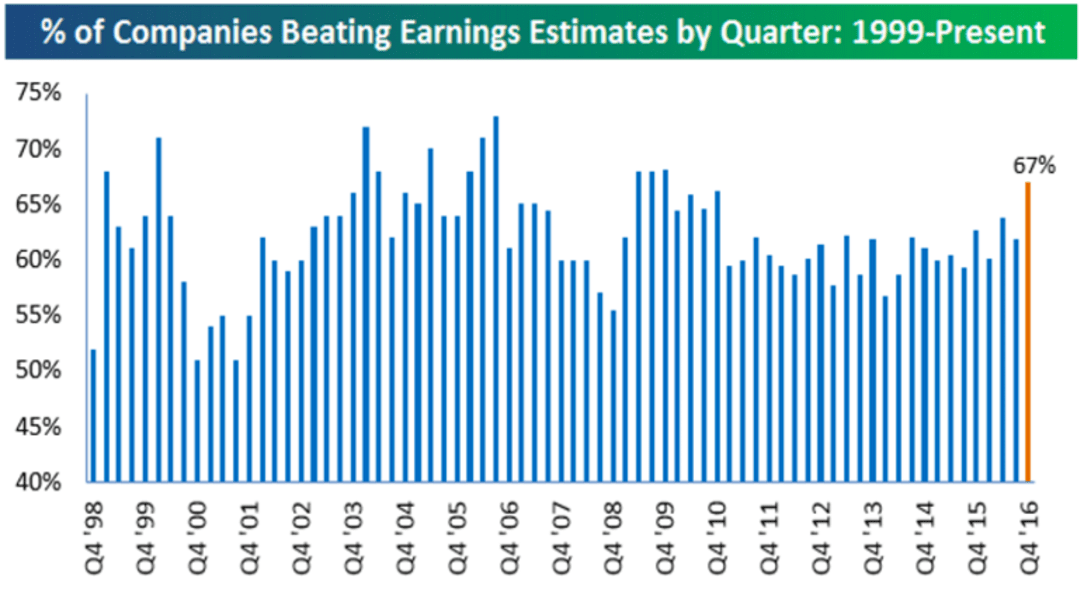
As I indicated in my previous graph column, global economic momentum clearly picked up in the fourth quarter, so it will be interesting to see if that is also reflected in the earnings figures. And yes, the graph above does seem to indicate that it was a strong quarter for earnings too. Two thirds of the companies that have reported figures have published results that have beaten estimates. At this point we are looking at the best quarter since 2010, which means we can shrug off any fears of an earnings recession.
Still some reasons for caution
So on the face of it, things look reasonably encouraging, but there are still some reasons not to get too optimistic just yet and these are:
-
To date only 10% of companies have published their figures: the final results will largely depend on the 90% still to come. The blog where I came across this graph also states that the positive surprises ‘generally lessen as the earnings season progresses’. That is also my experience when it comes to these kinds of graphs: at the beginning of every quarter we seem to be heading for a new record, but if you look back when the quarter is over, there is suddenly no longer any sign that the figures were particularly strong. I am not really sure why this is, but I imagine it has something to do with earnings adjustments that take place during the quarter itself. If Intel, for example, reports strong figures, everyone promptly revises up their expectations for Microsoft or Daimler, which reduces the likelihood of positive surprises for these companies.
-
Positive earnings surprises don’t all have the same impact either. Two relatively small companies can report better-than-expected results while one large concern reports very disappointing figures. In this case, the results would be positive in terms of the graph above, but would have a much less positive effect on the S&P 500. As an alternative to this, below I have reproduced Bloomberg’s graph of positive earnings surprises. Bloomberg looks at the size of the actual earnings compared to the expected earnings. This graph also shows that that the number of results that have beaten estimates exceeds those that haven’t (the S&P 500 has currently reported 3.5% more profits than were expected), but it would be an exaggeration to say to say that the fourth quarter was exceptionally strong.
Not all that many positive earnings surprises

Source: Bloomberg
-
Earnings are one thing, but what about revenues? The picture here is also less favorable than that shown by the first graph. Although better-than-expected results dominate here too, the fourth quarter still appears to be more average than spectacular, with a score of 57% on positive results surprises. Here too the percentages decline as the season progresses, and we actually end up with a relatively weak quarter in terms of positive surprises.

-
It is important to remember that we are of course talking about results that are better than their estimates. The fact that there was not a single quarter in the period 2007-2009 when negative surprises dominated, while the reported earnings per share virtually halved, indicates that this does not really say much about the underlying trend. The positive point here is that the better-than-expected figures are relative to forecasts that were already fairly positive: according to Bloomberg data earnings growth of 4% is expected for the fourth quarter.
-
If I look at earnings per share over a 12-month period, the last reported figure according to Bloomberg was USD 107.9 per share, which is still 5% below the levels seen at the end of 2014. In this same period, the S&P 500 has risen 10%. This would appear to suggest that the market is already discounting quite a lot of positive news. In other words: let’s hope that the fourth quarter really does show healthy earnings growth…
