https://www.bespokepremium.com/think-big-blog/its-the-most-volatile-time-of-the-year/
On Friday, the US stock market suffered a significant correction and since then things have been pretty bumpy. Surprising? Not if you believe what the graph shows.
To say it was a pretty boring summer would be an understatement! When I came back from my vacation the market was about 0.9% higher, interest rates had hardly moved and even most exchange rates gave me the impression I had only been away for a day. It’s possible, of course, that I happened to leave and come back at exactly the right time, missing out on a flurry of activity, but apparently that wasn’t the case either. The S&P 500 did not go up or down by more than 1% on a single day, as a result of which the VIX, the measure of priced in volatility, fell to its lowest level of the year. Last Friday, it would have been exactly two months since the S&P 500 had moved up or down by more than 1% in one day’s trading, something that has only happened once in the last ten years. The epitome of boring.
And then that Friday happened. The US market opened 1% lower and the loss expanded to almost 2.5% by the close of trading. Everyone was citing rate hike jitters as the reason. But that wasn’t entirely credible. How likely the market thinks it is that a rate hike will occur is reflected in something called the federal funds futures. If we look at what these expectations were for a rate hike in September, they rose that day from 28% to 30%. Two weeks earlier, on 26 August, this figure rose from 32% to 42% and then the market fell by precisely 0.15%. So it was unclear why the market fell 2.5% when the likelihood was only 2% higher.
Whatever the reason, stability suddenly seems to be a thing of the past. Where for the last two months we chose to overlook all the news about the US elections, Italian banks, earnings and macro data, now all hell breaks loose on the markets at the slightest rumor.
Logical!
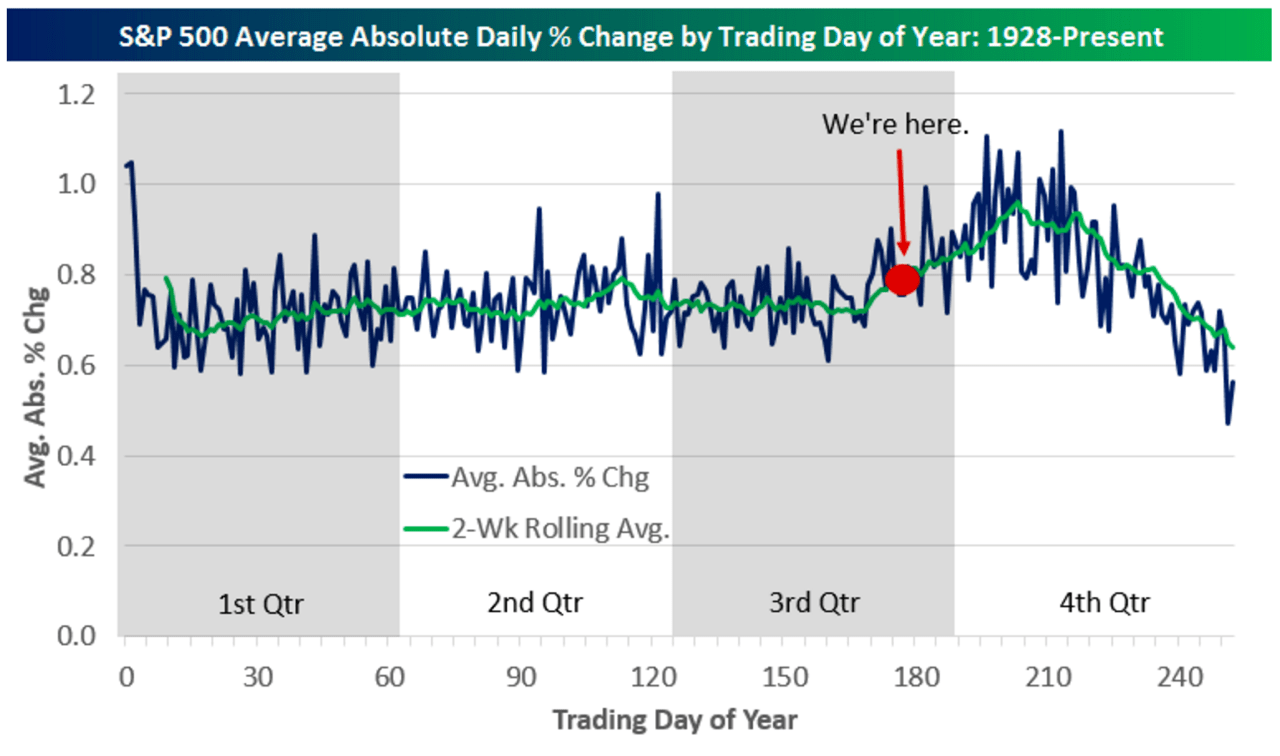
That’s logical, say the makers of the top graph. “The recent higher volatility may have come as a shock, but it is completely normal if you look at the seasonal pattern” Enter the graph. This graph shows the average daily price movement of the S&P 500 throughout the years based on data going back to 1928. To prevent negative and positive results from canceling each other out, they use the absolute figures. It shows that the first trading day of the year usually registers a significant move: the 1.5% decline with which the S&P 500 opened this year is no exception. Another interesting point is the bump that occurs at the end of the third quarter. On average the numbers rise in the months of August through October, after which calm returns.
September is the worst month
Source: Bloomberg, Robeco

Higher figures don’t really matter that much: if all the numbers are positive there is nothing to worry about. However, unfortunately, volatility also frequently produces poor results too, as shown in the second graph. Using monthly S&P 500 data, I have kept a tally of how often the different months have registered a positive (black) or negative (turquoise) result since 1928. The orange line then shows the balance. As it turns out, September is the only month of the year when investors have historically lost more often than they have won.
Markets like low volatility
Source: Bloomberg, Robeco

Another way of showing that volatility is generally not all that favorable is to look at how the S&P 500 would have moved if you had only invested on low-volatility as opposed to high-volatility days. Not that you can do much with this information, given that you can only establish what sort of day it was after the fact, but still, the difference is pretty significant.
One tiny problem…
Historically, the data clearly shows a link. However, there’s a problem. What’s missing is an explanation. Why did the market fail to get worked up about a rate hike in August and then suddenly plummet in September after a tiny change? I don’t actually believe that interest rate fears were the real issue here, but that still leaves the question of what exactly happens in September and October that causes there to generally be more volatility in the market. Don’t get me wrong: I can come up with various reasons why the markets will become more volatile in the coming months: an Italian referendum, US elections, economic slowdown in China, more Brexit unrest. But the point is that these factors only apply to this year and don’t explain why on average these months are more volatile. With the exception of the US elections, these are all temporary issues and not necessarily linked to the fall – the Chinese economy can also weaken in the first quarter, for example.
So, in a nutshell, there is a link, but I haven’t found a good explanation for it anywhere yet. And so I have to admit that I don’t agree with those who think that Friday’s market decline was ‘not a surprise’.
