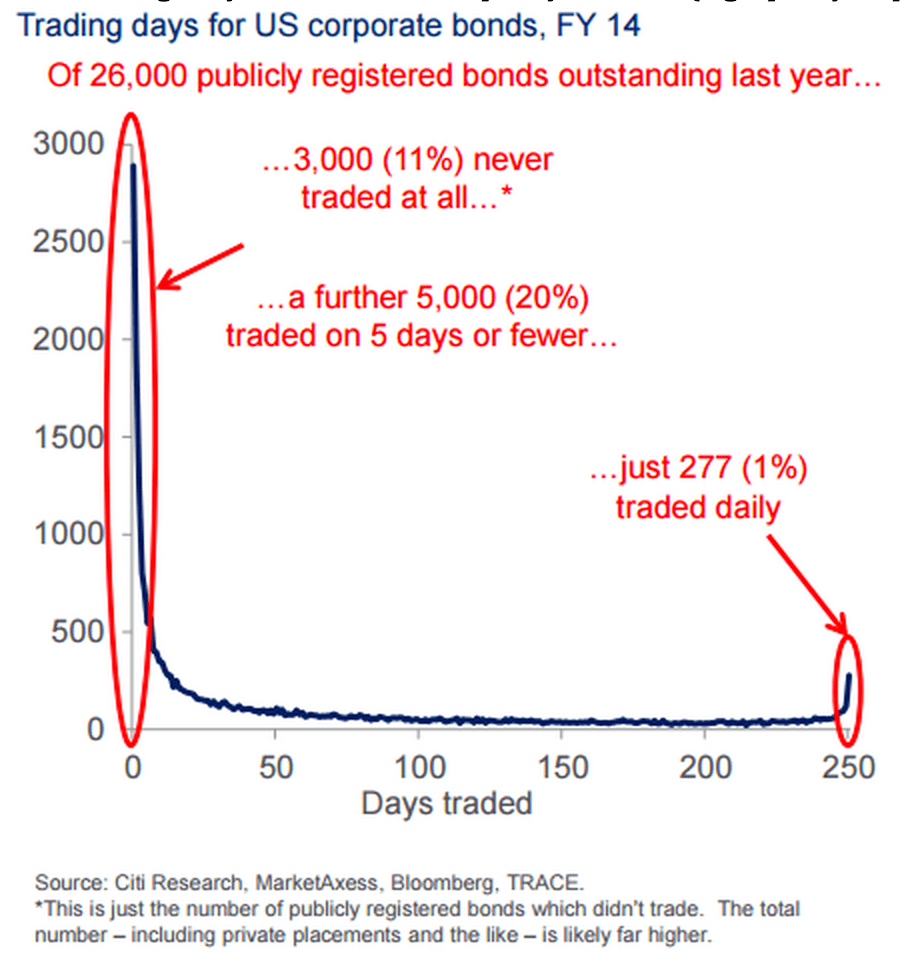
Good morning. Very cool chart on the liquidity in credits (high quality corporate bonds)
http://www.bloombergview.com/articles/2015-08-26/it-was-the-worst-of-ideas
The development in spreads of the Eurozone versus the US
https://www.bondvigilantes.com/blog/2015/08/27/cost-quality-spread-differentials-ig-credit-rating-bands/

I could have made a bet that this one would pop up before long
http://www.businessinsider.com/cost-of-missing-best-days-stock-market-2015-8

A number of charts on guns in the US. This one is pretty clear: more guns lead to more deaths…
http://www.vox.com/2015/8/24/9183525/gun-violence-statistics

No clue how the model works, but here you go…
http://uk.businessinsider.com/albert-edwards-thinks-were-in-a-bear-market-2015-8

Inflation under Kuroda: a temporary blip?
http://www.economist.com/news/finance-and-economics/21662606-life-keeps-getting-harder-japans-central-bankers-core-concern

I get the feeling I have shown this one before. My question would have been: what are the lines in there for?
http://uk.businessinsider.com/how-food-prices-impact-inflation-in-different-economies-2015-8

“How exposed are American households to the stock market?”
http://www.economist.com/blogs/freeexchange/2015/08/american-economy

A complete overview of all previous editions of Best of the Web can be found herehttp://tinyurl.com/c8ge4c5. All links provided are collected from public websites, unless otherwise specified. I have not checked the data or information for accuracy used, and therefore do not guarantee that all data provided will be 100% correct. The links provided do not necessarily reflect my personal opinion and should be seen as general interest: oftentimes I do not agree with arguments presented, but nevertheless think it is worthwhile to read them. It is up to the reader to make up their own mind. Suggestions or discussions are more than welcome. Do not quote unless specifically cleared beforehand!
